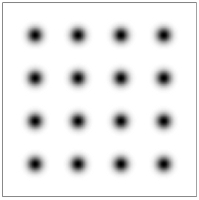
Creates a constellation diagram according to the QAM (quadrature amplitude modulation) order and given SNR (signal-to-noise) value.
The output of the channel is $y = s + n$ with $s$ signal and $n$ noise ($s, n$ complex). And the Gaussian probability density function (PDF) of the noise is:
$p_n(\xi, s) = \frac{1}{2 \pi \sigma^2}e^{-\frac{1}{2{\sigma}^2}((\xi_\mathrm{re}-s_\mathrm{re})^2 + (\xi_\mathrm{im}-s_\mathrm{im})^2)}$
with $\mathrm{SNR}_s = \frac{E_s}{N_0}=\frac{\mathrm{E}[ss^*]}{\mathrm{E}[nn^*]}$
$\mathrm{E}[ss^*]=E_s=1$; $~~\mathrm{E}[nn^*]=N_0=2\sigma^2$; $~~\sigma = \frac{1}{\sqrt{2}}10^{-\mathrm{SNR}_s[\mathrm{dB}]/20}$
At channel output, the PDF is:
$p_y(\xi)=\sum_{i=1}^{M}\mathrm{P}[S=s_i] \cdot p_n(\xi, s_i)$
with $M$ order of the QAM, with equally likely signal points, i.e. $\mathrm{P}[S=s_i]=1/M$.
Note that for plotting, the pdf is normalized such that its maximum value is 1.