Sign Distribution

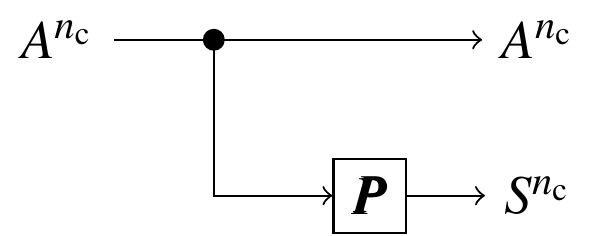
- Binary systematic rate $(m-1)/m$ generator matrix $\boldsymbol{G}=[\boldsymbol{I}|\boldsymbol{P}]$.
- Binary amplitude representation $\boldsymbol{b}(A_i)\in\{0,1\}^{m-1}$ .
- Binary sign representation $b(S_i)\in\{0,1\}$.
- $[b(S_1),\dotsc,b(S_{n_\text{c}})]=[\boldsymbol{b}(A_1),\dotsc,\boldsymbol{b}(A_{n_\text{c}})]\boldsymbol{P}$.
- $S_i$ are approximately uniformly distributed: $P_S(-1)=P_S(1)=\frac{1}{2}$.
→ The transceiver output $A\cdot S$ has the optimal MB distribution!
Illustration of the Uniform Check-Bit Assumption
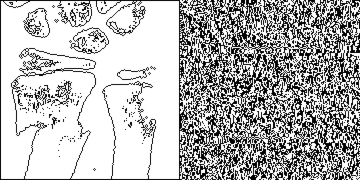
The following example illustrates the validity of the uniform check-bit assumption. We encode a b/w image with a DVB-S2 rate 1/2 LDPC code. The image has a strongly biased distribution towards "0", i.e., the white color is dominating. Examining the distribution of the check-bits, we observe that the resulting distribution of zeros and ones is nevertheless uniform:
- Data: empirical distribution $P_D(1) = 1-P_D(0) = 0.1082$.
- Check bits: empirical distribution: $P_R(1) = 1-P_R(0) = 0.4970$.

