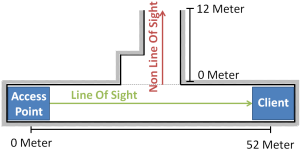
The following two slides will give an overview of how WLAN signals can fade under LOS (Line-Of-Sight) and NLOS (Non-Line-Of-Sight) szenarios. Therefore 20 MHz WLAN signals were measured for the depicted secnario you can see in the picture on the right. Measured WLAN signals always come from the access point which resides on the left and were measured every 2 meter.
The displayed OFDM spectrum includes all 64 subcarriers of the OFDM WLAN signal. The 4 left and 3 right unused subcarriers (guard bands) are used to estimate the noise floor. Subcarrier 0 is also unused due to DC. The subcarriers -21, -7, 7 and 21 are used for pilot symbols. All other subcarriers are used for data and are shown in the constellation diagram. The data-subcarriers have indicies from -28 to -22, -20 to -8, -6 to -1, 1 to 6, 8 to 20 and 22 to 28.
The shown OFDM spectrum represents the uncorrected receiving signal, while the shown constellation diagram shows the corrected symbols of the data-subcarriers.
If 'Colorization' is used, connected data-subcarriers are colorized, which helps interpreting the corrected symbols in the constellation diagram.
It can be chosen, which data-subcarriers should be shown in the constellation diagram. Remember that only data-subcarriers will be displayed in the constellation diagram.

